The USGS just debuted a complete remaking of the water cycle diagram—with humans as headliners
by bernt & torsten
The U.S. Geological Survey (USGS) water cycle diagram is still used by hundreds of thousands of students in the United States and worldwide. It’s also the basis for many, many spin-off diagrams.
The agency released a new diagram for the first time in more than 20 years, with humans as showrunners.
Although people have long siphoned water from groundwater and diverted rivers into farm fields and industrial plants, the new diagram is the first time humans have been included in what was presented until now as a “natural” cycle.
The new diagram is the first time humans have been included in what was previously presented as a “natural” cycle.
The change reflects the latest 20 years of research uncovering humanity’s central role in the cycle and how to communicate it visually.

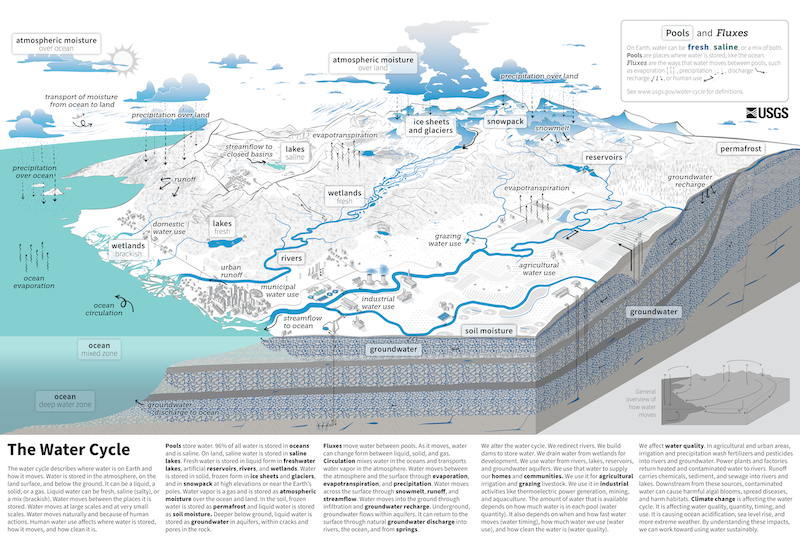
In addition to natural processes like ocean evaporation, precipitation over land, and runoff, the new diagram features grazing, urban runoff, domestic and industrial water use, and other human activities. Each label in the chart comes from data tracking the significant paths and pools of water worldwide.

The Billion-Kronor Man and the Thousand Workers Behind Him
An Ode to Greed, Served With Golden Cutlery
In a land not so far away,...

Why I Wrote a Novel Instead of a Manifesto About AI
I could have written an essay. A whitepaper. A TED-style...

Bring Your Own AI - The Double-Edged Sword of Modern Workplaces
In the bustling corridors of modern corporations, a silent revolution unleashes unprecedented...